NSW Updated Design Storm Guidance
This page summarises updated guidance which was developed in studies funded by the NSW Department of Climate Change,
Energy, the Environment and Water (DCCEEW), including the Review of ARR Losses (2019) and the
Review of NSW Storm Types (2024).
These studies identified that the standard ARR 2016 design storm approach exhibits an underestimation bias for rare storms.
Key findings include:
- The underestimation bias may be caused by insufficient pre-burst rainfall in design storms.
- Rare flood events in NSW are often driven by multi-day rainfall followed by intense bursts.
- Different storm mechanisms tend to dominate different parts of the flood frequency curve and are more likely to occur at different times of the year, particularly East Coast Lows.
- Pre-burst distributions are highly skewed (i.e. 75th percentile pre-burst depths are far higher than 50th percentile) and should vary with event rarity.
- Continuing loss should vary with AEP to better represent catchment wetness and infiltration curves.
The updated methods aim to improve design flood estimation through:
- Introducing a standardised, reproducible representation of pre-burst rainfall patterns
- Adoption of AEP-dependent continuing loss
- Use of regionalised loss values where calibration is not available
- A revised hierarchical framework for selecting losses and pre-burst
AEP-Dependent Loss and Pre-burst Approach
Continuing loss (CL) should be anchored at the 10% AEP and adjusted for other events as described in Table 1.
The recommended pre-burst quantiles are also AEP dependent and shown in Table 1.
Table 1: Recommended AEP dependent Pre-burst quantiles and Continuing Loss Adjustments
| AEP | Pre-burst Quantile | CL Adjustment |
|---|---|---|
| 1% and rarer | 75th percentile | CL10% - 1 |
| 2% | 75th percentile | CL10% - 0.75 |
| 5% | 75th percentile | CL10% - 0.35 |
| 10% | 75th percentile | CL10% |
| 20% | 50th percentile | CL10% + 0.2 |
| 50% | 50th percentile | CL10% + 0.75 |
This approach reflects decreasing infiltration rates at the time of the burst for rarer storms due to higher pre-burst depths and wetter antecedent conditions.
Pre-burst and Pre-burst Temporal Pattern Updates
New pre-burst depth grids have been developed for NSW, using an additional 10+ years of data.
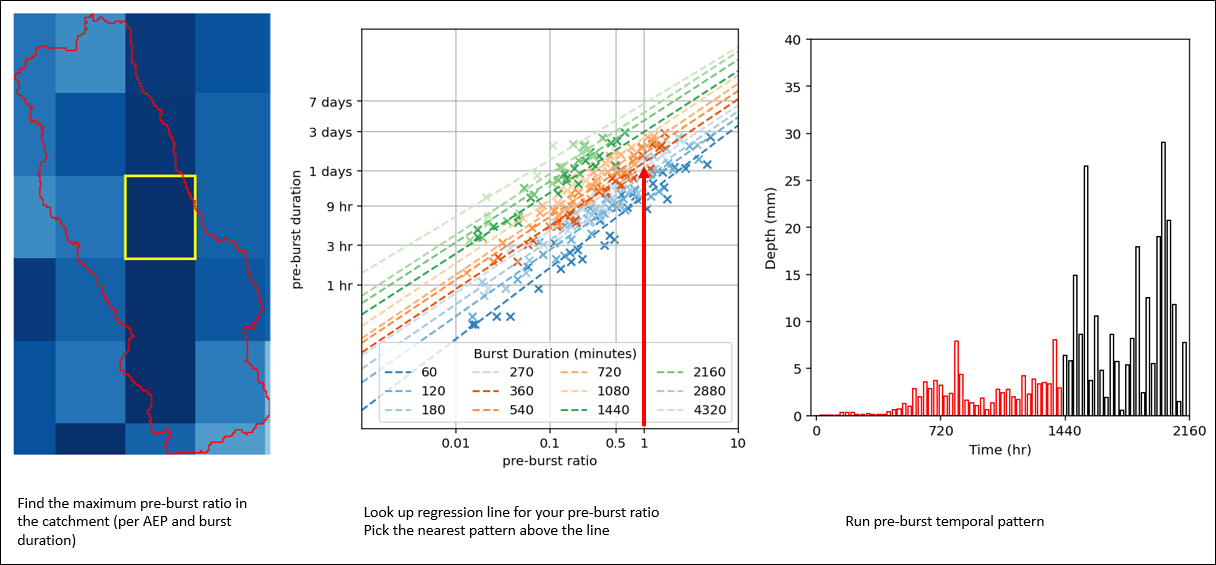
A new method for selecting pre-burst temporal patterns has been developed. This is described below:
- Determine the maximum pre-burst ratio in the catchment.
- Select the regression relationship based on burst duration (e.g. assuming the maximum 360 minute pre-burst ratio in the catchment is 1.0, we move vertically up to find the pre-burst duration).
- Select the closest pre-burst temporal pattern (above the regression line) from the bank of patterns.
Fixed-duration patterns (e.g. Jordan 2005 or GSAM patterns) are not recommended for NSW design storm modelling.
Regional Loss Values (Ungauged Catchments)
Where no at-site FFA or calibration data exists, regionalised losses are recommended as a last resort:
Table 2: Recommended Regional Loss Values
| Region | Initial Loss (IL) | CL (10% AEP) |
|---|---|---|
| Northern Rivers | 20 | 2 |
| Mid-North Coast | 20 | 3 |
| Hunter | 30 | 2 |
| Northern Inland | 20 | 3 |
| Hawkesbury/Georges | 30 | 2 |
| Illawarra/Shoalhaven | 30 | 2 |
| Southern NSW | 30 | 2.5 |
| Murrumbidgee/Murray | 30 | 3.5 |
| Macquarie/Lachlan | 30 | 2 |
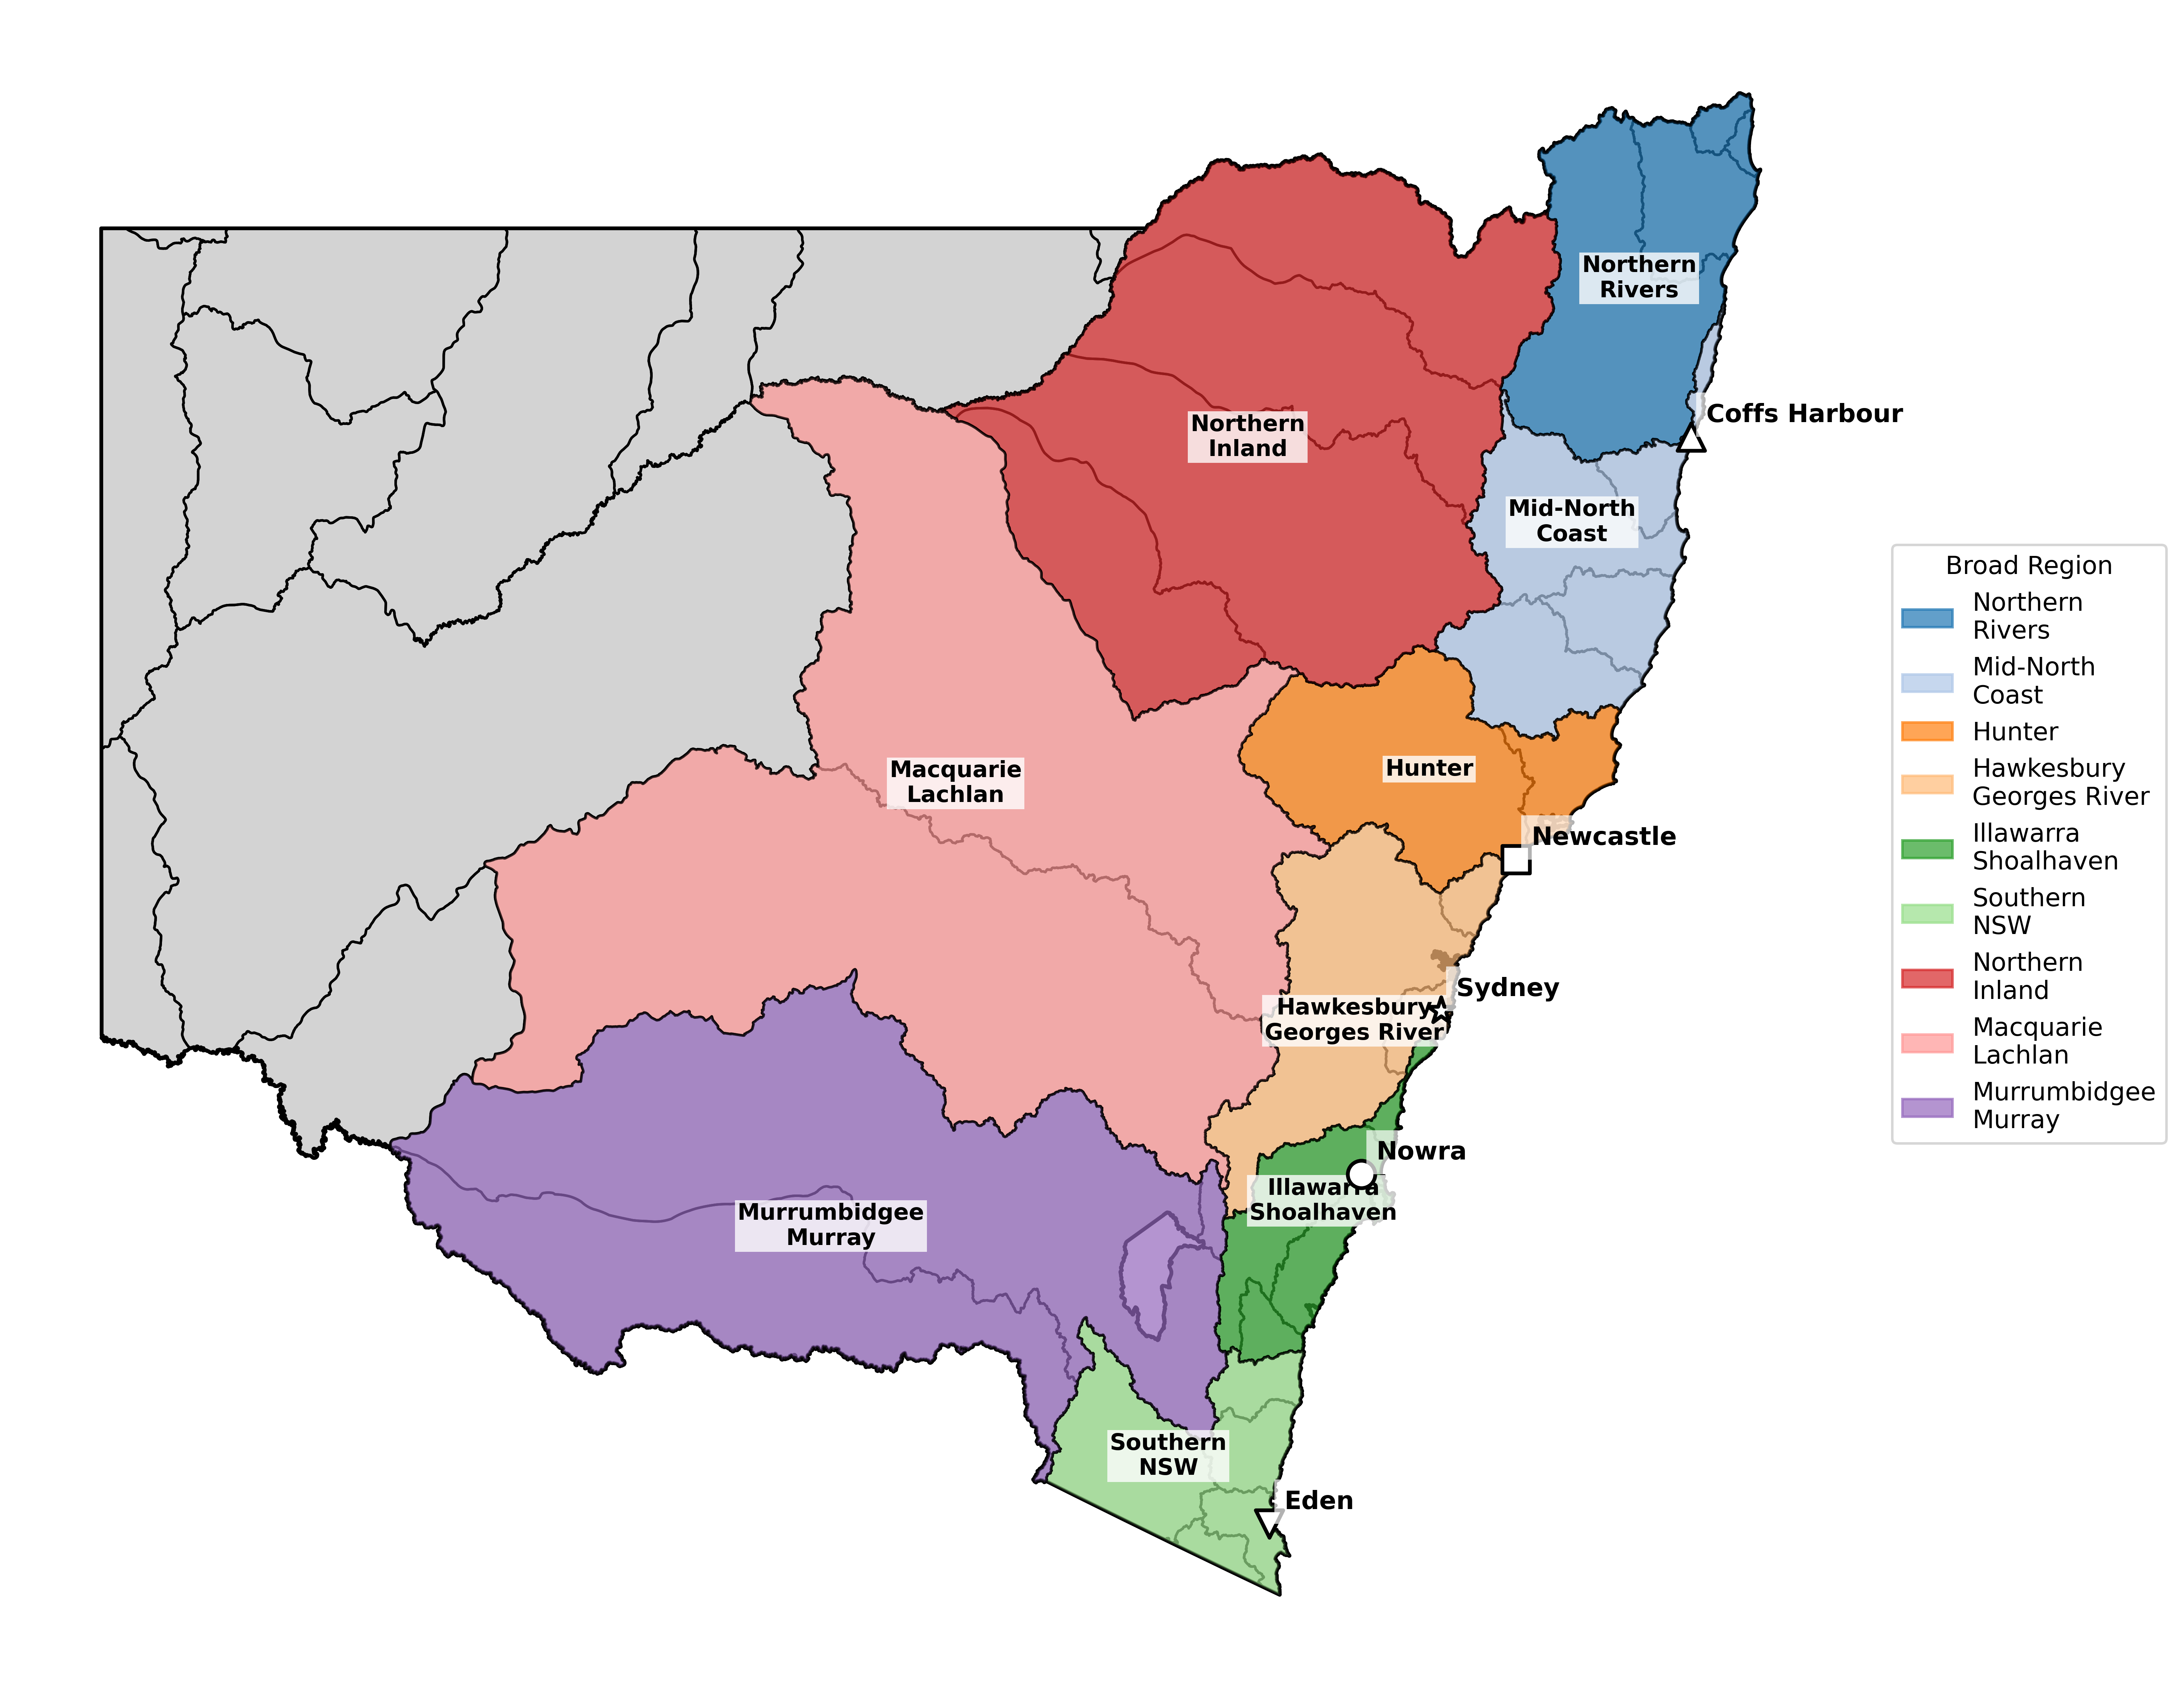
These values are intended to replace ARR Project 6 loss grids where no better data is available.
Updated Design Storm Hierarchy
Practitioners should adopt the following hierarchy (1.1 = most preferred, 3.1 = least preferred):
- At-Site Data Available
- Quality at-site FFA
- FFA available but no calibration
- Calibrated model without at-site FFA
- Translated Data Available
- Calibrated model/losses in upstream or downstream catchment
- Calibrated model/losses in adjacent catchment(s)
- FFA reconciled losses
- None of the Above
- Table 2 Regional IL and CL10%
Probability neutral burst losses and default ARR Data Hub losses are no longer recommended in NSW. Instead it is recommended to run a pre-burst temporal pattern with regional burst losses in Table 2.
The hierarchy of approaches are summarised in Table 3 and Diagrams 1a and 1b.
Table 3: Hierarchy of Approaches from most (1.1) to least (3.1) preferred
| Available Data | # | Available Data | Pre-burst | IL | CL |
|---|---|---|---|---|---|
| 1. At-Site Data (At-Site FFA or Calibration) | 1.1 | Quality FFA Model calibrated to historical events. |
AEP dependent.
50th percentile for 50% AEP and 20% AEP. 75th percentile for 10% AEP and rarer*. |
Start with the average of the calibration events; modify IL if a better fit to the FFA can be achieved. |
AEP dependent. Use the average calibration CL and consider the rarity of historical events. e.g. if three historical events with a rarity of around 10% AEP are available, assign their average CL for 10% AEP. Then adjust other AEPs based on the values recommended in Table 1. Modify AEP dependent CL if better fit to FFA can be achieved. |
| 1.2 | Quality FFA is available but no calibration events. | As Above | Find the IL loss which best matches the at-site FFA. | As above (Modify AEP dependent CL if better fit to at-site FFA can be achieved) | |
| 1.3 |
No FFA available. Calibrated model to historical event(s). |
As Above | Average of calibration losses | As Above (with no ability to reconcile to FFA) | |
| 2. Translated Data (No At-Site FFA or Calibration) | 2.1 |
No At-Site FFA or Calibration. Calibrated model parameters upstream or downstream of the target location. |
As Above | Average of calibration from adjacent catchments. |
AEP dependent. Use average of calibration continuing losses from adjacent catchments. Consider rarity of historical events and adjust CL for other AEPs using Table 1. If RFFE is suitable for the catchment1, check design flows are reasonable Modify with scrutiny if it is justified. |
2.2 |
No At-Site FFA or Calibration. Calibrated models available in adjacent catchment or from other studies. |
As Above | Average of calibration from adjacent catchments. |
AEP dependent Use average of calibration continuing losses from adjacent catchments Consider rarity of historical events and adjust CL for other AEPs using Table 1. If RFFE is suitable for the catchment1, check design flows are reasonable Modify with scrutiny if it is justified. |
| 2.3 | None of the above but catchment overlaps with FFA-reconciled catchments (or it is adjacent to them). | As Above |
Use the new NSW FFA-reconciled losses (available through the ARR Data Hub NSW specific page) It is recommended that the reconciled losses from both option 13 and 15 are investigated. These losses may be used within the catchment in which they were derived (available through the ARR Data Hub) or similar adjacent catchments with appropriate scrutiny. |
||
| 3. No At-Site or Translated Data Available | 3.1 | None of the above | As Above | Fixed regional IL from Table 2. |
AEP dependent Fixed regional CL from Table 2 for 10% AEP and with the proposed parameter set from Table 1 for the rest of design events. Modify with scrutiny if it is justified. |
|
* Use 50th percentile pre-burst quantile at 10% AEP transition zone if a better a fit to the FFA can be achieved. 1 Check RFFE is suitable via RFFE 2021 |
|||||
Key Guidance
- Always prioritise calibration to historical events where possible
- Fit losses to at-site FFA quantiles
- Use AEP-dependent losses and pre-burst
- Apply engineering judgement and scrutiny when transferring losses
- Use regional values only as a last resort
Diagram 1a: At-Site Data Approaches (1.1-1.3)
Reconcile to FFA
AEP-dependent pre-burst"}} B -->|No| D("FFA available?") D -->|Yes| G{{"1.2: FFA reconciled losses
Match IL to FFA"}} D -->|No| E("Calibration available?") E -->|Yes| F{{"1.3: Calibration losses
AEP-dependent pre-burst & adjustments"}} E -->|No| H([Move to Translated Data]) %% Styling classDef best fill:#057534,color:#ffffff; class C,G,F best;
Diagram 1b: Translated and No Data Approaches
Adjust for AEP & context"}} B -->|No| D("Adjacent catchment studies?") D -->|Yes| E{{"2.2: Use adjacent calibration
AEP adjustments & scrutiny"}} D -->|No| F("Near FFA-reconciled catchments?") F -->|Yes| G{{"2.3: NSW FFA-reconciled losses"}} F -->|No| H{{"3.1: Regional default losses
Use Table 2 + Table 1"}} %% Styling classDef best fill:#057534,color:#ffffff; class C,E,G,H best;